 BSD Ports
What the disks cost the search index
Loading 105,000 ports into mddb ran at 125 documents a second on the server. Half the time went to fsync on spinning disks; the rest to a database that grew to 2.5 GB.
Adding four ports trees meant loading about 70,000 new documents into mddb, the search engine behind the search box, plus one update of every FreeBSD document. It took 30 minutes, about 125 documents a second. mddb's own benchmark speaks of thousands. This is what the difference was.
Half the time was waiting for the disk
The server has two 7200 rpm disks from 2011 in a ZFS mirror, with no separate
log device, so every fsync waits for a platter. dtrace counted the fsync
calls mddbd made in ten seconds of the load:

758 calls, 6.75 ms each. A request of 500 documents should need about two commits, one for the documents and one for the full-text index, since mddb learned to index a whole batch in one transaction. It made about 300 fsyncs per request instead.
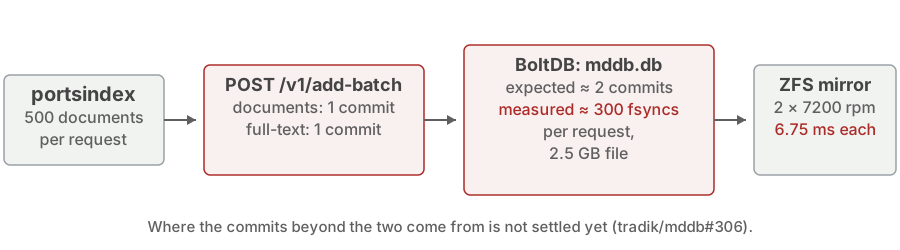
Where the commits beyond those two come from is not settled. The metadata index queue commits once per document, which is the first suspect, but dtrace could not attach to the Go binary to prove it. The measurement is reported to mddb as tradik/mddb#306.
Measured again, the same way everywhere
A first guess from a laptop said "sixteen times slower", and it was wrong: the laptop and the server were not doing the same thing. So the same 5,000 documents went into an empty database, 500 per request, from the same client, in four places:
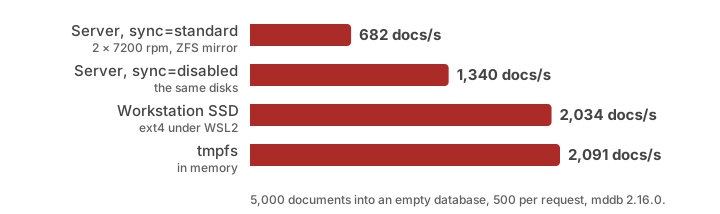
On an empty database, the disks cost a factor of two, not sixteen. The rest of the gap belongs to size: the full load wrote a 2.5 GB file for 105,124 documents, about 24 KB each, and each commit on a large tree touches more pages than on a small one. The rate fell as the file grew.
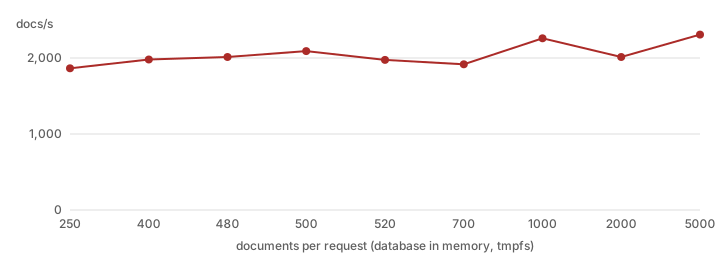
The size of a request, which looked like the culprit for a while, is not:
What changed
mddb's database is an index of the ports trees. It can be rebuilt from them
at any time, so it does not need the durability fsync buys. It now lives on
a ZFS dataset of its own with sync=disabled (and 16 KB records, closer to
BoltDB's pages), and only that dataset: the rest of the server is unchanged.
Should the server lose power, the worst case is a full reload, which the
refresh does by itself.
A refresh sends only what changed: the first one after the move updated four documents in two seconds. The benchmarks page now times ten searches after every refresh, shows how many documents and revisions mddb holds and what the last load sent, so a change like this one shows up in numbers rather than in a feeling that the site is slow.
Update, 22 October: the commits were found
mddb 2.17.0 answered #306 the next morning. The extra commits came from the embedding worker, which after storing a document's chunks opened two more write transactions, usually empty, each with its fsync: three commits per document. It now commits once, and only when something changed.
2.17.0 also added a counter, mddb_db_write_transactions_total, that makes
this visible without dtrace. Ten requests of 500 documents into an empty
database on the server: the counter went from 16 to 36. Two commits per
request, the documents and the full-text index, as it should be.
The load rate on this server barely moved: the same 5,000 documents, the two
versions taking turns while a refresh ran beside them, went at 506–564
documents a second on 2.16.0 and 535–584 on 2.17.0. With two commits per
request, what is left is the work itself on a CPU from 2011, and the amount
each commit writes, which sync=disabled still lets the disks take in their
own time (923 documents a second). On faster disks, or with embeddings
configured, the fix is the part that shows.
The same release fixed what this site's new search filters ran into:
filterMeta was applied to the best limit results instead of to every
match, so a filtered search could show 7 ports where 100 matched; and facets
can now be counted over every match (facetScope: "all"). The search page
uses both: "library" finds 21,739 ports, counted per system, category and
maintainer.